
Hello, CUDA! Full tutorial on getting started from scratch, with profiling!
Profiling 7 Implementations: Why bad CUDA code makes GPUs slower than CPUs
I can’t believe my stroke of luck, I actually managed to snag a Nvidia 5090 Founders Edition at retail price! Retail price is $2000, but it’s always out of stock, and secondary markets are reselling it at minium twice that… Anyway, I’ve been eyeing one for over a year now, and at last I got one. All hail the 5090! (just kidding, I couldn’t resist making this AI-generated image)
I’ve been pretty curious about the limits of throughput performance that is causing such a shortage of every type of computer hardware possible today (RAM, SSDs, Flash, CPUs, and of course GPUs). Who would have thought the price of computer parts would increase by such a factor! And all because these AI companies complain about not enough compute, even though they’re furiously buying up all the compute.
I had to dive in. But I didn’t really want to rent a GPU online. So I waited my turn, until I landed a consumer-grade one that wasn’t scalped (b/c I refuse to support scalpers). Plus, I wanted one for gaming.
After building the computer, setting up the environment, and running some CUDA code, I found the initial benchmark results to be promising! But, there’s a wrong way to use CUDA that severely handicaps performance, so I’ll demonstrate and explain.
This tutorial will use the classic “hello world”-esque problem for CUDA, which is vector addition. We will be profiling vector addition in a LOT of different ways, which, in my opinion, is the most exciting part. I will assume the environment runs in Linux Ubuntu 26.04 LTS. All code will be written in C++.
I will be glossing over some details about the GPU hardware and the CUDA programming model (such as threads, thread-blocks, thread-block clusters, grids, warps, Streaming Multiprocessors) because this guide is meant to get you started on profiling performance as soon as possible.
If you’d like to know what the GPU is capable of, you can skip to the results to see the numbers.
Run 1: CPU only, single-core
Let’s say we didn’t have a GPU. Surely we can still add vectors and measure the performance. Let’s see how good our CPU is. (Your CPU might be different from mine, so it’s hard to establish a universal baseline. But assume for a 2026 CPU.)
# main.cpp
#include <iostream>
#include <chrono>

void cpuAddVector(float* v1, float* v2, float* result, int N) {
    for (int i = 0; i < N; ++i) {
        result[i] = v1[i] + v2[i];
    }
}

void initializeVector(float* v1, float* v2, int N) {
    for (int i = 0; i < N; ++i) {
        v1[i] = 1.0;
        v2[i] = 3.0;
    }
}

bool verifyResult(float* result, int N) {
    for (int i = 0; i < N; ++i) {
        if (result[i] != 4.0) {
            std::cout << result[i] << std::endl;
            return false;
        }
    }
    return true;
}

int main() {
    const int N = 10'000'000; // 10 million
    size_t size = N * sizeof(float);

    // allocate memory
    float* v1 = (float*)malloc(size);
    float* v2 = (float*)malloc(size);
    float* result = (float*)malloc(size);

    // initialize vector values
    initializeVector(v1, v2, N);

    // timed run
    auto t1 = std::chrono::high_resolution_clock::now();
    cpuAddVector(v1, v2, result, N);
    auto t2 = std::chrono::high_resolution_clock::now();
    double cpuSeqTime = std::chrono::duration<double, std::milli>(t2 - t1).count();

    // error checking
    if (!verifyResult(result, N)) {
        std::cout << "WRONG!" << std::endl;
    }

    // deallocate memory
    free(v1);
    free(v2);
    free(result);

    std::cout << "Time benchmark: " << cpuSeqTime << " ms" << std::endl;

    return 0;
}
Let’s compile it and run:
g++ main.cpp -o app$ ./app
Time benchmark: 26.3874 msThis is our baseline CPU running on 1 core without any optimizations. By default g++ compiles with no optimizations, or optimization level 0 (-O0). The GPU absolutely cannot do worse than this, or else it was a huge waste of money.
Run 2: CPU only, multi-core
Before we reach for our GPU, let’s try using all our threads on the CPU. Almost all modern CPUs are multi-threaded.
Firstly, let’s check how many threads I’ve got:
$ nproc
16
I have 16 threads. Actually, I have 8 cores, and 2 threads per core. lscpu gives full details. Should I expect a 8x or 16x speedup?
So, cores contain the actual math-heavy engine, called an ALU (arithmetic logic unit), whereas the thread is more like a workstation for the core. A thread “workstation” comes with everything required for context-switching, such as the program counter, registers, interrupt handlers, instruction queues, memory management, etc. The hardware architecture side of things is quite interesting, but I won’t go that much more into detail. At a high level, threads come in handy when there’s either a lot of waiting or unpredictability. We see this with multi-tasking or when there’s a lot of context-switching. But since we are doing a bunch of additions without any context-switching, we shouldn’t expect the threads to help us much with speedup.
All we need to do is add 2 new lines, and add a new compiler flag option.
# main.cpp
#include <iostream>
#include <chrono>
#include <omp.h> // new

void cpuAddVectorMulticore(float* v1, float* v2, float* result, int N) {
    #pragma omp parallel for // new
    for (int i = 0; i < N; ++i) {
        result[i] = v1[i] + v2[i];
    }
}

void initializeVector(float* v1, float* v2, int N) {
    for (int i = 0; i < N; ++i) {
        v1[i] = 1.0;
        v2[i] = 3.0;
    }
}

bool verifyResult(float* result, int N) {
    for (int i = 0; i < N; ++i) {
        if (result[i] != 4.0) {
            std::cout << result[i] << std::endl;
            return false;
        }
    }
    return true;
}

int main() {
    const int N = 10'000'000; // 10 million
    size_t size = N * sizeof(float);

    float* v1 = (float*)malloc(size);
    float* v2 = (float*)malloc(size);
    float* result = (float*)malloc(size);

    initializeVector(v1, v2, N);

    auto t1 = std::chrono::high_resolution_clock::now();
    cpuAddVectorMulticore(v1, v2, result, N);
    auto t2 = std::chrono::high_resolution_clock::now();
    double cpuSeqTime = std::chrono::duration<double, std::milli>(t2 - t1).count();

    if (!verifyResult(result, N)) {
        std::cout << "WRONG!" << std::endl;
    }

    free(v1);
    free(v2);
    free(result);

    std::cout << "Time benchmark: " << cpuSeqTime << " ms" << std::endl;

    return 0;
}
g++ -fopenmp main.cpp -o app$ ./app
Time benchmark: 3.11137 msYup, 8 cores give about an 8x speedup compared to 1 core.
Run 3: CPU only, with maximum compiler optimizations
Modern compilers are a beast, especially on boring uninteresting code that just does the same thing over and over and over again in massive quantities. Some optimizations include: vectorization (SIMD, aka Single Instruction, Multiple Data), loop unrolling, software pipelining. In the case of SIMD, imagine we need to do the same operation (add) over multiple different data (the two input vectors and the one output vector). The CPU hardware has the capability to do this if the compiler does the setup.
If you’re interested, there is a way to observe the compiler’s output by reading the assembly it generates. Add the -S flag to g++, and you’ll see a main.s output file with the assembly. Fair warning: it’s very verbose to read. We won’t do that here, maybe that’s for a future post.
Anyway, let’s measure both single-core and multi-core:
# main.cpp
#include <iostream>
#include <chrono>
#include <omp.h>

void cpuAddVectorSinglecore(float* v1, float* v2, float* result, int N) {
    for (int i = 0; i < N; ++i) {
        result[i] = v1[i] + v2[i];
    }
}

void cpuAddVectorMulticore(float* v1, float* v2, float* result, int N) {
    #pragma omp parallel for
    for (int i = 0; i < N; ++i) {
        result[i] = v1[i] + v2[i];
    }
}

void initializeVector(float* v1, float* v2, int N) {
    for (int i = 0; i < N; ++i) {
        v1[i] = 1.0;
        v2[i] = 3.0;
    }
}

bool verifyResult(float* result, int N) {
    for (int i = 0; i < N; ++i) {
        if (result[i] != 4.0) {
            std::cout << result[i] << std::endl;
            return false;
        }
    }
    return true;
}

int main() {
    const int N = 10'000'000; // 10 million
    size_t size = N * sizeof(float);

    float* v1 = (float*)malloc(size);
    float* v2 = (float*)malloc(size);
    float* result = (float*)malloc(size);

    initializeVector(v1, v2, N);
    auto t1 = std::chrono::high_resolution_clock::now();
    cpuAddVectorSinglecore(v1, v2, result, N);
    auto t2 = std::chrono::high_resolution_clock::now();
    double cpuSeqTime_singleCore = std::chrono::duration<double, std::milli>(t2 - t1).count();
    if (!verifyResult(result, N)) {
        std::cout << "WRONG!" << std::endl;
    }

    initializeVector(v1, v2, N);
    t1 = std::chrono::high_resolution_clock::now();
    cpuAddVectorMulticore(v1, v2, result, N);
    t2 = std::chrono::high_resolution_clock::now();
    double cpuSeqTime_multiCore = std::chrono::duration<double, std::milli>(t2 - t1).count();
    if (!verifyResult(result, N)) {
        std::cout << "WRONG!" << std::endl;
    }

    free(v1);
    free(v2);
    free(result);

    std::cout << "Time benchmark singleCore: " << cpuSeqTime_singleCore << " ms" << std::endl;
    std::cout << "Time benchmark multiCore : " << cpuSeqTime_multiCore << " ms" << std::endl;

    return 0;
}
g++ -O3 -fopenmp main.cpp -o app$ ./app
Time benchmark singleCore: 14.1897 ms
Time benchmark multiCore : 1.42404 msThat’s close to a 2x speedup for both single-core and multi-core! We’ve reached the best that the CPU can do, so now it’s time to move onto the GPU.
Run 4: GPU naive
Before we get started with code, here’s a few primers you should know about working with a GPU:
- Host = CPU, Device = GPU
- GPU compute’s smallest unit of work is the kernel, which is basically a function that we need to write. You can assume that this function will be layered in several for loops. It’s the work that each thread performs, which enables massively parallelizable work. (more on that later)
- Host and Device have separate memory. Host uses RAM on the motherboard, whereas Device uses VRAM. Prior to doing any work on the GPU, we must allocate memory on VRAM. If we want to retrieve the results back for the CPU, we need to memcpy it off VRAM and onto RAM.
- CUDA offers an abstraction called Unified Memory, which is basically virtual memory that can be used by both CPU and GPU. Under the hood, CUDA will do the memcpy operations for you. I will not use Unified Memory in this tutorial because I want full control over these expensive memcpy operations. Generally, Unified Memory is only used in prototyping and not production-grade code.
There’s a lot more detail than that, but that’s enough to get us started.
# main.cu <-- notice the different suffix here for CUDA
#include <iostream>
#include <cuda_runtime.h>

// all CUDA kernels require the keyword prefix of '__global__'
__global__
void gpuAddVector(float* v1, float* v2, float* result, int N) {
    for (int i = 0; i < N; ++i) {
        result[i] = v1[i] + v2[i];
    }
}

void initializeVector(float* v1, float* v2, int N) {
    for (int i = 0; i < N; ++i) {
        v1[i] = 1.0;
        v2[i] = 3.0;
    }
}

bool verifyResult(float* result, int N) {
    for (int i = 0; i < N; ++i) {
        if (result[i] != 4.0) {
            std::cout << result[i] << std::endl;
            return false;
        }
    }
    return true;
}

int main() {
    const int N = 10'000'000; // 10 million
    size_t size = N * sizeof(float);

    // allocate Host (CPU) memory
    float* h_v1 = (float*)malloc(size);
    float* h_v2 = (float*)malloc(size);
    float* h_result = (float*)malloc(size);

    // initialize data on Host
    initializeVector(h_v1, h_v2, N);

    // allocate Device (GPU) memory
    float *d_v1, *d_v2, *d_result;
    cudaMalloc(&d_v1, size);
    cudaMalloc(&d_v2, size);
    cudaMalloc(&d_result, size);

    // copy memory of input from Host to Device
    cudaMemcpy(d_v1, h_v1, size, cudaMemcpyHostToDevice);
    cudaMemcpy(d_v2, h_v2, size, cudaMemcpyHostToDevice);

    // profiling
    cudaEvent_t start, stop;
    cudaEventCreate(&start);
    cudaEventCreate(&stop);
    cudaEventRecord(start, 0);

    // submit job to GPU
    // the triple brackets here is CUDA-specific syntax. more on this later.
    gpuAddVector<<<1, 1>>>(d_v1, d_v2, d_result, N);

    // profiling
    cudaEventRecord(stop, 0);
    cudaEventSynchronize(stop);
    float time_ms = 0;
    cudaEventElapsedTime(&time_ms, start, stop);
    cudaEventDestroy(start);
    cudaEventDestroy(stop);

    // copy memory of output from Device to Host
    cudaMemcpy(h_result, d_result, size, cudaMemcpyDeviceToHost);

    // error checking
    if (!verifyResult(h_result, N)) {
        std::cout << "WRONG!" << std::endl;
    }

    // deallocate Device (GPU) memory
    cudaFree(d_v1);
    cudaFree(d_v2);
    cudaFree(d_result);

    // deallocate Host (CPU) memory
    free(h_v1);
    free(h_v2);
    free(h_result);

    std::cout << "Time benchmark: " << time_ms << " ms" << std::endl;

    return 0;
}
Take careful note that I treat Host vs Device memory separately. They both need to be allocated, processed, and deallocated. And in-between, we need to feed the input from Host into Device, and after running the computation, we need to extract the output from Device into Host.
For the profiling portion of the code, I am only measuring the time the kernel takes to do the work and not including the memcpy between Host and Device. The TLDR for why the timer is written this way is that the GPU has its own clock and we must use the GPU’s clock and not the CPU’s clock. Otherwise, it won’t be an accurate measure of how long the computation takes. This is because the GPU job doesn’t necessarily start right away since it’s async. The GPU, however, knows when it starts, so we need to take measurements from the GPU and not the CPU.
Other than that, the remaining portion of the code is pretty much the same. Now let’s compile and run:
nvcc main.cu -o app$ ./app
Time benchmark: 470.018 msWhoa! That’s really high! Aren’t GPUs supposed to be fast? Why is it significantly slower than the CPU?
This is because we are only using a single thread on the GPU to do all the work for all 10M elements in the vectors. For every element, the poor single thread needs to fetch the values from VRAM (which takes hundreds of GPU cycles), compute (which takes very few cycles), and store the value back to VRAM (which, again, takes hundreds of GPU cycles). The lesson here is that any time we load memory from VRAM into the thread’s registers, it takes a really really long time, so we want to avoid that whenever possible.
Run 5: GPU, multiple threads
Remember that <<<>>> syntax? It means how many blocks and how many threads. (I’ll have another post in the future describing blocks and threads.)
Looks like we set both the block and thread counts to 1. Let’s see what happens if we increase the thread count to 256. (I like to change one variable at a time so I can see how much it contributes to performance. If I modify too many variables at a time, it makes it harder for me to tell the impact of a single parameter.)
We also need to update the kernel slightly. Remember how I said the kernel is wrapped around by multiple for loops? Well, threadIdx and blockDim are sorta like the “i” and “j” in the for loop. This helps us tell each thread what the indexes are so it can appropriately parallelize. That way each thread gets its own set of indexes and it does not collide with another thread.
gpuAddVector<<<1, 256>>>(d_v1, d_v2, d_result, N);__global__
void gpuAddVector(float* v1, float* v2, float* result, int N) {
int index = threadIdx.x;
int stride = blockDim.x;
for (int i = index; i < N; i += stride) {
result[i] = v1[i] + v2[i];
}
}nvcc main.cu -o app$ ./app
Time benchmark: 10.2551 msOkay, that’s significantly better than single-threaded GPU, but still far worse than what our CPU can manage on its own with multi-core and compiler-optimizations.
What if we increased the number of threads? Can we just increase this number to a really really really large number? I wish it were so simple. Threads run within a thread-block, and CUDA has a hard limit of 1024 threads per thread-block, otherwise it will throw a runtime exception. But since we have some room, let’s bump it up to 1024:
gpuAddVector<<<1, 1024>>>(d_v1, d_v2, d_result, N);nvcc main.cu -o app$ ./app
Time benchmark: 2.70848 msThis looks right. By having 1024 threads, we get a roughly 4x speedup compared to 256 threads. But, it’s still 2x slower than CPU’s best.
Run 6: GPU, multiple thread-blocks
Up until now, we’ve only been running on 1 thread-block. Let’s see if having more thread-blocks can help get us there.
Each thread-block can have up to 1024 threads, so if we do some math, we need (N + 1024 - 1) / 1024 total thread-blocks. That will give us enough thread-blocks to cover all of N, plus 1 extra at the very end. This last thread-block won’t necessarily need all the threads within the thread-block, unless N is perfectly divisible by our block size of 1024.
int blockSize = 1024;
int numBlocks = (N + blockSize - 1) / blockSize;
gpuAddVector<<<numBlocks, blockSize>>>(d_v1, d_v2, d_result, N);
__global__
void gpuAddVector(float* v1, float* v2, float* result, int N) {
int index = blockIdx.x * blockDim.x + threadIdx.x;
int stride = blockDim.x * gridDim.x;
for (int i = index; i < N; i += stride) {
result[i] = v1[i] + v2[i];
}
}nvcc main.cu -o app$ ./app
Time benchmark: 0.24313 msNow that’s more like it! We beat CPU’s best by a factor of 5x.
Our Results..?
When we vector-add for 10M elements, this is what we get:
| Hardware/Software Configuration | Time (ms) | Speedup vs Best CPU |
|---|---|---|
| CPU single-core no-compiler-optimizations | 25.8193 ms | -18x |
| CPU multi-core no-compiler-optimizations | 3.1113 ms | -2x |
| CPU single-core with-compiler-optimizations | 14.1897 ms | -10x |
| CPU multi-core with-compiler-optimizations | 1.4240 ms | 1x |
| GPU single-thread | 470.0180 ms | -330x |
| GPU single-block | 2.7084 ms | -2x |
| GPU multi-block | 0.2431 ms | 5x |
I’m baselining off of CPU’s best, which is “CPU multi-core with compiler-optimizations”. It’s not a universal baseline because this is my CPU, and your CPU may be different. Negative speedup means we slowed down by that much, and positive speedup means we did better by that much.
GPU single-thread and GPU single-block are actually slower than CPU best here, so those are the wrong ways to use the GPU. But GPU multi-block, aka GPU’s best, only gets a 5x speedup up from CPU’s best.
Is that it???
Well, there’s a few reasons for this:
- Vector-addition is a very simple and repeatable and 1-dimensional problem that the CPU is fairly good at optimizing. 2-dimensional problems like matrix-multiplication will be much harder for CPU to optimize. (More on that in a later post.)
- 10 million elements is not actually a lot. We can run a few more experiments with incrementally larger numbers. Let’s do that for funsies, and let’s also run it with smaller N size.
Final Results
| N size | CPU Best (ms) | GPU Best (ms) | GPU Speedup |
|---|---|---|---|
| 1,000 | 0.32922 ms | 1.23235 ms | -4x |
| 10,000 | 0.32270 ms | 0.15750 ms | 2x |
| 100,000 | 0.34920 ms | 0.16752 ms | 2x |
| 1,000,000 | 0.57375 ms | 0.15712 ms | 3x |
| 10,000,000 | 3.22636 ms | 0.24313 ms | 13x |
| 100,000,000 | 28.93440 ms | 0.93980 ms | 30x |
| 1,000,000,000 | 271.26400 ms | 7.81178 ms | 34x |
All I did was change the vector size and re-run for CPU-best and GPU-best.
Notice that as the number of elements increased, the GPU’s highly-parallelizable capabilities give it a bigger edge. And notice that as the number of elements decreased, GPU doesn’t actually help very much. So, GPU is only good for massively parallelizable jobs.
Now, I wish I could go even higher, but the largest I could do was 1B elements in the vectors. I tried for 10B also, but I ran out of memory. That math goes like: 3 arrays of 10B floats, where each float is 4 bytes, gives us 120GB of RAM and VRAM, which I don’t have. I have 32GB RAM and VRAM. 1B will work since I only need 12GB RAM and VRAM.
This reveals another fundamental constraint: memory size. Now, I could have allocated our memory in a smarter way instead of all-at-once by chunking, and that would fit everything, but the tradeoff is that I would need to offload the results to disk in between processing each chunk. And disk is much much much slower than RAM/VRAM. Many applications, especially AI training/inference for LLMs, do this because they absolutely have to.
Conclusion
If you made it all the way to the end, congratulations! This post turned out to be much longer than I thought it would be. But I hope you learned a bit about performance and how code, compilers, and hardware can affect your end performance!
A few things to keep in mind:
- My way of “profiling” in this post was pretty archaic, using timers. There are more granular and accurate ways to profile that I’ll explore in future posts.
- I only profiled the compute portion of the performance, which is when the additions are happening. I did not include the transfer overhead of memcpy-ing from Host to Device, and back. In reality, that is very real work too.
- I hand-waved through a lot of details about the GPU threads and thread-blocks in Runs 5 + 6, and how I chose the numbers. These are all part of the CUDA programming model, which is worth a read to get a better understanding. There’s a lot at play here, and perhaps I’ll break that down too in another post.
- I also skipped diving into the lower-level code for both the CPU and the GPU. Since my CPU is an AMD, it uses IA-32. Nvidia GPUs use what’s called PTX, which stands for parallel thread execution. Only by diving deep into those will it be possible to truly find performance optimization gaps that are untouched already. These are also topics for future posts.
I hope you had fun!
Appendix A: Building the PC
So I decided to build a gaming rig with the new epic Nvidia GeForce RTX 5090. I know a guy who’s really good at building PCs, and knows almost every part by memory, better than any associate you’d find at Microcenter. Even I don’t remember all the parts that I used in my head, but he probably still does. Got a huge assist in that department.
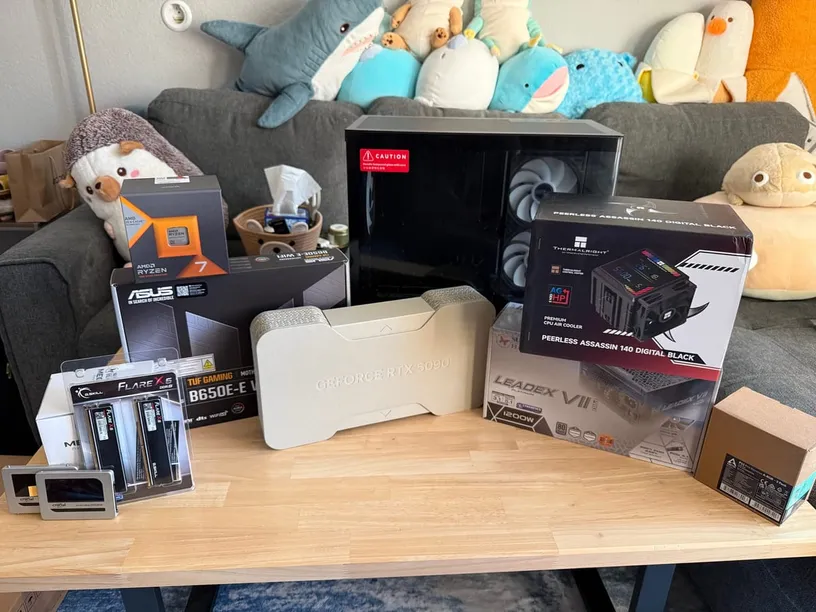
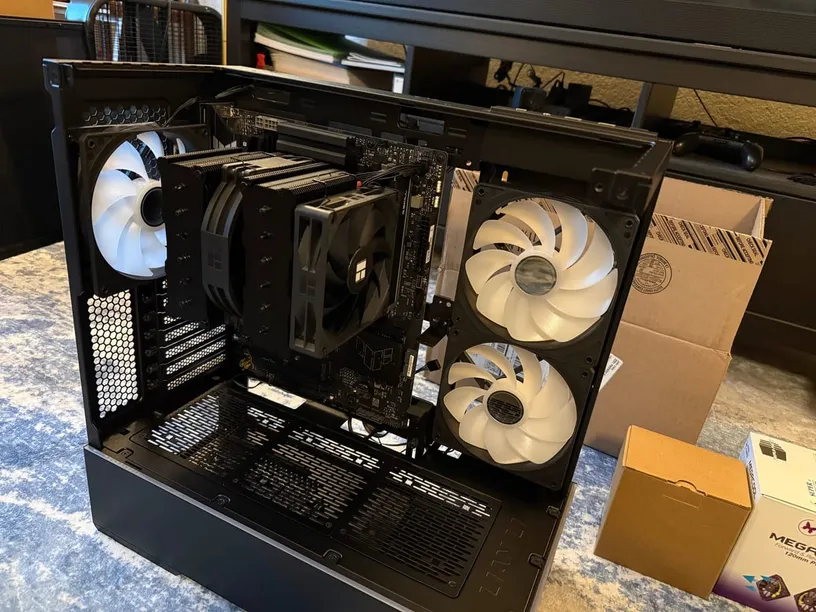
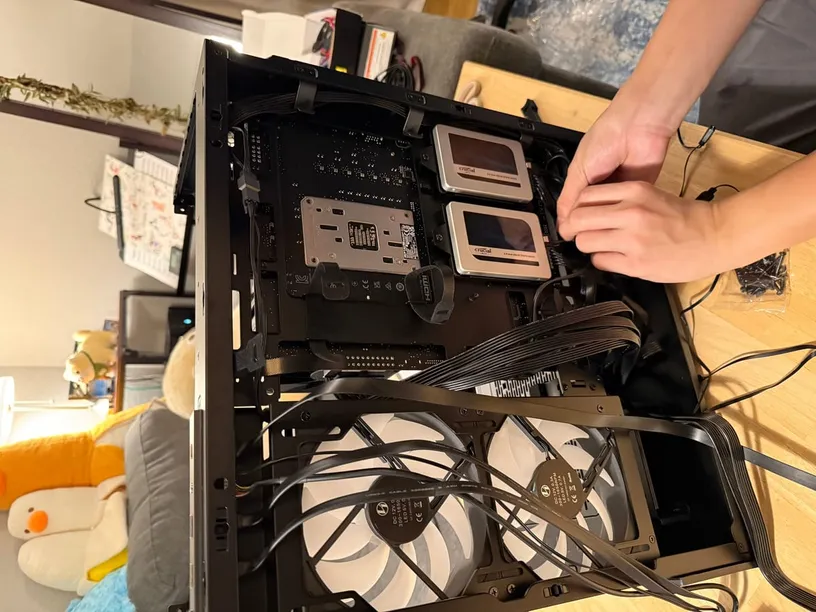
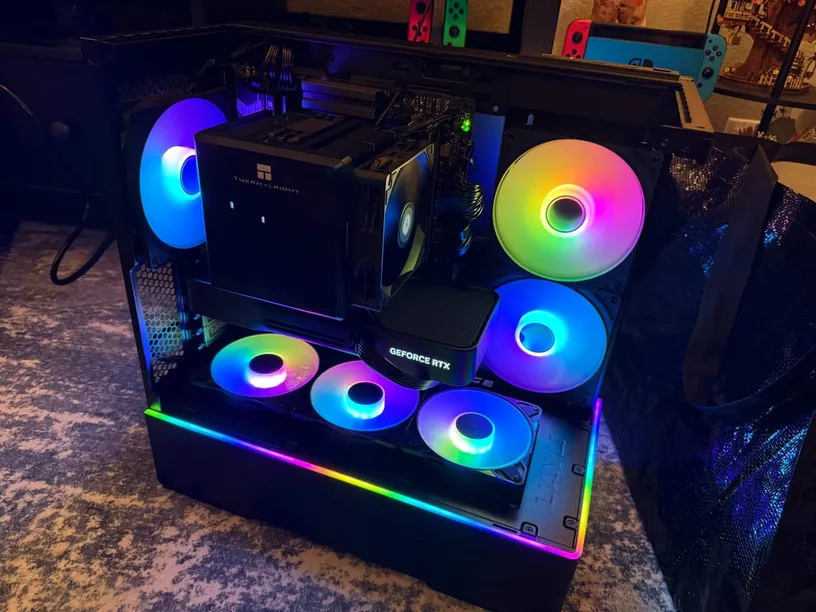
The key bottleneck here is you want to use PCIe Gen5 with all 16 lanes for the GPU, and you’ll need a compatible motherboard and CPU for that.
Appendix B: Environment Setup
Firstly, for OS I installed Ubuntu 26.04 LTS. I loaded the ISO onto a portable USB drive and booted the PC with this portable USB, and installed Ubuntu.
Once Ubuntu was installed, I disabled GNOME (the GUI) so I can have the graphics card dedicated fully 100% to only compute, not graphics rendering. This means the only interface against Ubuntu will be the command line, but I’m comfortable with that.
sudo systemctl set-default multi-user.targetNext, I find it convenient to ssh into my PC from my laptop. I’m a Mac user, and have been for over a decade. So I setup ssh securely. Be very careful about exposing ports to the outer world! Don’t do it unless you know what you’re doing!
Finally, install the nvidia drivers.
sudo apt install nvidia-cuda-toolkitUbuntu should have everything else you need. You can check:
$ which gcc
/usr/bin/gcc
$ which gdb
/usr/bin/gdb
$ which g++
/usr/bin/g++
$ which nvcc
/usr/bin/nvcc
$ which make
/usr/bin/make
And finally, a command to check the state of your Nvidia GPU:
$ nvidia-smi
+-----------------------------------------------------------------------------------------+
| NVIDIA-SMI 595.84                 Driver Version: 595.84         CUDA Version: 13.2     |
+-----------------------------------------+------------------------+----------------------+
| GPU  Name                 Persistence-M | Bus-Id          Disp.A | Volatile Uncorr. ECC |
| Fan  Temp   Perf          Pwr:Usage/Cap |           Memory-Usage | GPU-Util  Compute M. |
|                                         |                        |               MIG M. |
|=========================================+========================+======================|
|   0  NVIDIA GeForce RTX 5090        Off |   00000000:01:00.0 Off |                  N/A |
|  0%   41C    P8             15W /  575W |       2MiB /  32607MiB |      0%      Default |
|                                         |                        |                  N/A |
+-----------------------------------------+------------------------+----------------------+

+-----------------------------------------------------------------------------------------+
| Processes:                                                                              |
|  GPU   GI   CI              PID   Type   Process name                        GPU Memory |
|        ID   ID                                                               Usage      |
|=========================================================================================|
|  No running processes found                                                             |
+-----------------------------------------------------------------------------------------+
References
- https://docs.nvidia.com/cuda/cuda-programming-guide/index.html
- https://docs.nvidia.com/cuda/cuda-programming-guide/01-introduction/programming-model.html
- https://developer.nvidia.com/blog/even-easier-introduction-cuda/
- https://developer.nvidia.com/blog/easy-introduction-cuda-c-and-c/
- https://www.reddit.com/r/CUDA/comments/1oun3ct/thread_block_warp_core_and_sm_how_do_i_connect/
- https://www.dbernadett.com/essays/cuda/